
Trash threatens the lake’s beneficial uses, Natural beauty and wildlife.
Floating and submerged trash is a danger to boaters. There is risk of injury to birds and animals. Chemical residuals in aerosol spray cans could seep into the lake. Anyone seeing this blight would wonder how Jordan Lake could be a public water supply. If these stains upon the land are not removed, the local economy can be hurt if lake users go elsewhere.
1,700 square miles of watershed flush trash to lake with every rainfall

Heavy red line represents boundary of the Haw River Watershed (1,400 square miles) and heavy pink line, the boundary of the New Hope Creed Watershed (300 square miles. Many, many little creeks, streams and rivers feed into these two major sources that enter Jordan Lake.
TRASH AND URBANIZATION
The Haw River watershed at the southern end of the lake comprises a land area of about 1,400 square miles and the New Hope River at the northern end accounts for an additional 344 square miles. While much smaller in area, the New Hope River watershed is highly urbanized. About 720,000 people live in these two watersheds. Rapid urbanization throughout the watersheds over the last 30 years is evident in Google Earth Engine Time Lapse. Click on the arrow in lower left of map to see history unfold and click on + or - to see smaller or larger area.
Surprisingly, recreational use is NOT the major source of trash although it is a terrible eyesore. Instead, anything on the land in the vast watershed of the lake can be flushed away by heavy rainfalls directly or through storm drains into streams that eventually feed the lake.
TRASH in STORMWATER
Trash found on the shoreline at the entrance to the lake from the Haw River, far above recreational use areas, is proof that it originates from the watershed.
In addition to the usual expectation of bottles, cans and plastic packaging, our volunteers routinely find children’s toys, dolls, basketballs, softballs, baseballs, soccer balls, fuel and hydraulic fluid containers, pesticide spray applicators, cigarette lighters and much more. Even refrigerators, orange road construction barrels, hot water heaters and tires (many still on rims) are found along the high water mark of many remote coves, especially on the Haw River Arm of Jordan Lake. Most recently, we found several heavy plastic water meter covers imprinted with City of Greensboro.

Trash ends up hundreds of feet into the woods above the shoreline. This happens because the lake level rises after rainfalls.
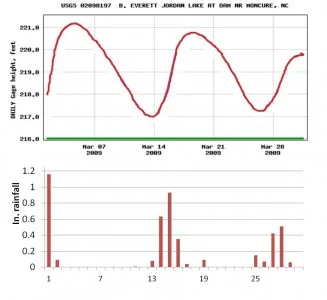
Lake level from water data:usgs March 2009. Rainfall from NOAA Greensboro Piedmont Triad International Airport
Here is a sample of historical record of lake level rise and associated rainfall in one month. A rainfall of less than 2 inches early in the month caused the level to increase by 3 feet. Vivid evidence of the stormwater-trash connection was collected by Clean Jordan Lake. We keep records of the miles of shoreline and the bags collected in each cleanup event.
Click here to track the lake level in real time and compare to previous years.

The tons of trash arriving from the Haw River watershed (1,400 sq. mi.) with each significant rainfall was estimated as follows: A significant rainfall over the entire watershed was indicated by a lake level rise (LLR) of 2 ft or greater. Trash picked up from 2014 to 2020 was assumed to have arrived with the 44 LLRs during this time period [NOTE: volunteers had worked hard for five years prior to remove most of the historical accumulation]. Bags filled were multiplied by 20 lb and divided by the LLRs. The result is 1.5 tons of trash enters from the Haw River with each significant rainfall. Have a look at our GIS (Geographic Information System) Shoreline Trash Map to see in detail where along the shoreline and how much trash (lb/100 ft) accumulates with each rainfall.